Generating stable SVG plots with Matplotlib
Using Matplotlib to generate stable SVG files for your documentation, BI dashboards and blog posts by dropping the date metadata and fixing the hash salt
Problem
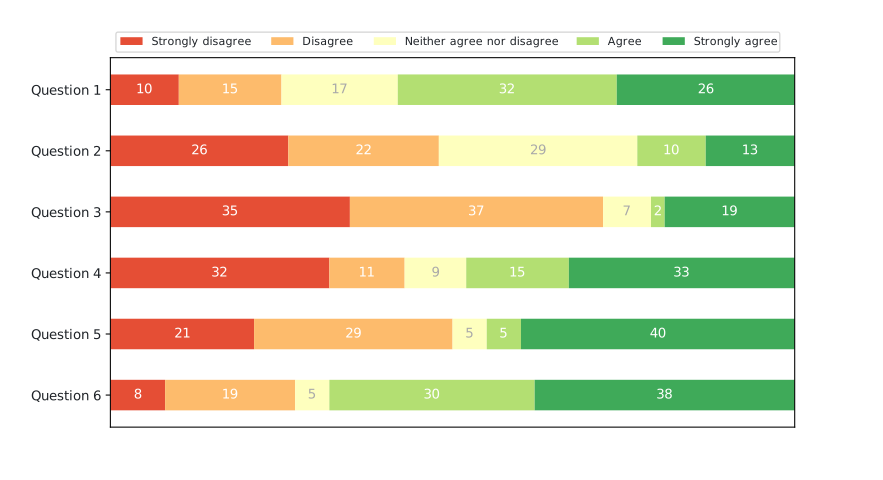
Consider the following example script that generates a stacked bar plot and saves it to disk:
This saves the plot to image.svg. If you re-run the script, you'll notice the
new SVG is not identical to the old one. In particular, the two versions differ
in their <dc:date> tag value
and in their element UIDs
- " clip-path="url(#p73a07e3568)" style="fill: #e54e35"/>
+ " clip-path="url(#p6a552af139)" style="fill: #e54e35"/>
Solution
The <dc:date> tag is part of the SVG metadata. From the Matplotlib SVG docs:
Metadata in the SVG file defined as key-value pairs of strings, datetimes, or lists of strings [...]. Values have been predefined for
'Creator','Date','Format', and'Type'. They can be removed by setting them toNone.
so it can be removed with the following change:
The element UIDs are generated using a uuid4 by default, but the
svg.hashsalt SVG backend parameter allows you to set a
custom hash.
This Matplotlib configuration parameter can be set conveniently using the
rc_context context manager:
import matplotlib as mpl

config = {
    "svg.hashsalt": "04304ad1-5950-4c2a-b5ea-58eb3234aed2",
}
with mpl.rc_context(config):
    # generate your plot(s) here
Full example
# /// script
# dependencies = [
#    "matplotlib",
#    "numpy",
# ]
# requires-python = "==3.15.*"
# ///

import io

import matplotlib as mpl
import matplotlib.pyplot as plt
import numpy as np
from matplotlib.axes import Axes
from matplotlib.figure import Figure

category_names = [
    "Strongly disagree",
    "Disagree",
    "Neither agree nor disagree",
    "Agree",
    "Strongly agree",
]
results = {
    "Question 1": [10, 15, 17, 32, 26],
    "Question 2": [26, 22, 29, 10, 13],
    "Question 3": [35, 37, 7, 2, 19],
    "Question 4": [32, 11, 9, 15, 33],
    "Question 5": [21, 29, 5, 5, 40],
    "Question 6": [8, 19, 5, 30, 38],
}


def plot() -> tuple[Figure, Axes]:
    labels = list(results.keys())
    data = np.array(list(results.values()))
    data_cum = data.cumsum(axis=1)
    category_colors = plt.colormaps["RdYlGn"](np.linspace(0.15, 0.85, data.shape[1]))

    fig, ax = plt.subplots(figsize=(9.2, 5))

    ax.invert_yaxis()
    ax.xaxis.set_visible(False)
    ax.set_xlim(0, np.sum(data, axis=1).max())

    for i, (colname, color) in enumerate(zip(category_names, category_colors)):
        widths = data[:, i]
        starts = data_cum[:, i] - widths
        rects = ax.barh(
            labels,
            widths,
            left=starts,
            height=0.5,
            label=colname,
            color=color,
        )

        r, g, b, _ = color
        text_color = "white" if r * g * b < 0.5 else "darkgrey"
        ax.bar_label(rects, label_type="center", color=text_color)

    ax.legend(
        ncols=len(category_names),
        bbox_to_anchor=(0, 1),
        loc="lower left",
        fontsize="small",
    )

    return fig, ax


def main():
    config = {
        "axes.facecolor": "none",  # the page background shows through instead of a white plot background showing up in dark mode.
        "savefig.facecolor": "none",  # make image transparent
        "svg.fonttype": "none",  #  makes the text real <text> elements instead of glyph paths, so CSS can recolor it.
        "svg.hashsalt": "04304ad1-5950-4c2a-b5ea-58eb3234aed2",  # use this string as hash salt
    }
    with open("image.svg", "w") as f, mpl.rc_context(config):
        fig, ax = plot()

        # Tag the text that must follow the page theme (bar labels keep their own
        # contrast against the bar colors, which are the same in both themes).
        for i, text in enumerate([*ax.get_yticklabels(), *ax.get_legend().get_texts()]):
            text.set_gid(f"themed-{i}")

        css = """\
                <style type="text/css">
                [id^="themed-"] text { fill: #1f2328 !important; }
                @media (prefers-color-scheme: dark) {
                    [id^="themed-"] text { fill: #e6edf3 !important; }
                }
                </style>
            """

        buf = io.StringIO()
        fig.savefig(
            buf,
            format="svg",
            metadata={"Date": None},
        )
        f.write(buf.getvalue().replace("</defs>", f"</defs>{css}", 1))


if __name__ == "__main__":
    main()